Water Content:
Exploring Analytical Methods and Practical Considerations
Should I irrigate? Did I put in enough? I think it’s enough… Well, I’ll add a little more…
Damn, it’s much too wet now!
We’ve all had this thought, this fear that we’re not doing the right thing, even though there are many ways of measuring the water content of substrates. With experience, some people can determine the ideal moment to irrigate, without the need for measuring instruments. Even if there are occasional missteps, these people are often relatively accurate. As this skill is not transcribable, it is difficult to share it with everyone. Moreover, it is often based on a local climatic context and for a given substrate, and therefore difficult to transpose to other geographical areas. Others prefer to use more scientific methods based on decision-making tools, which will be the subject of a second article. In this article, we’ll try to untangle the different ways of expressing the water content of a horticultural substrate:
Gravimetric Analysis
A gravimetric analysis is an analysis based on mass variation. In our context, this means analyzing the variation of water mass present in a sample of substrate.
Example: you take 500g of wet substrate and dry it in an oven, in a microwave with extreme caution as it can catch fire, or with an automatic balance, and you obtain a dry mass of 100g. Having separated the water from the other components (peat, perlite, etc.), you can see that there was 400g of water. As a percentage, this will give you a moisture to dry mass ratio of:
![]()
The main drawback of this analysis is that it is destructive. In other words, you won’t be able to reuse the substrate sample taken to perform the analysis.
Volumetric Analysis
A volumetric analysis is a method for determining the quantity of water according to the volume it occupies in a defined space.
Example: let’s take the 500g of substrate from the previous example and assume that it fills a one-liter (or 1000ml) pot. Knowing that there was 400g of water (or 400ml), we can easily calculate the volumetric water percentage:
![]()
This means that we have two radically opposed results for the same one-liter pot with the same dry mass of substrate (100 g) and the same mass of water (400 g), only because our reference system has changed. This result is also greatly influenced by the way the containers are filled during analysis. In other words, by the compaction exerted during filling. As peat-based substrates are highly compressible, it’s easy to put in a little more substrate than there should be, and thus skew the results. Interesting, isn’t it? But then, which analysis should we use?
In fact, unlike gravimetric analysis, volumetric analysis is essential for establishing water availability in soils and substrates. What’s more, most physical analyses are based on volumetric water content, such as porosity measurements or water retention curves.
–
Analysis of Matrix Potential, or Tension
The matrix potential of a substrate, and of soil in general, measures the strength of the bonds between substrate or soil particles and water. This strength is measured using a tensiometer, and indirectly reflects the availability of water for plants. The unit of measurement for tensiometer data is the kilopascal (kPa), and in the context of horticultural substrates, values generally oscillate between -1 kPa and -10 kPa.
We therefore have two analyses that can give us a fairly accurate idea of the available water content in substrates. The first, the volumetric analysis, allows us to calculate a quantity, a volume of water in the substrate, and the second, the matrix potential analysis, allows us to evaluate the strength required by the plants to use the available water.
Combining the data from these two analyses on the same graph gives what is commonly known as a water retention curve. This is simply a graph showing volumetric water content as a function of matrix potential or tension.
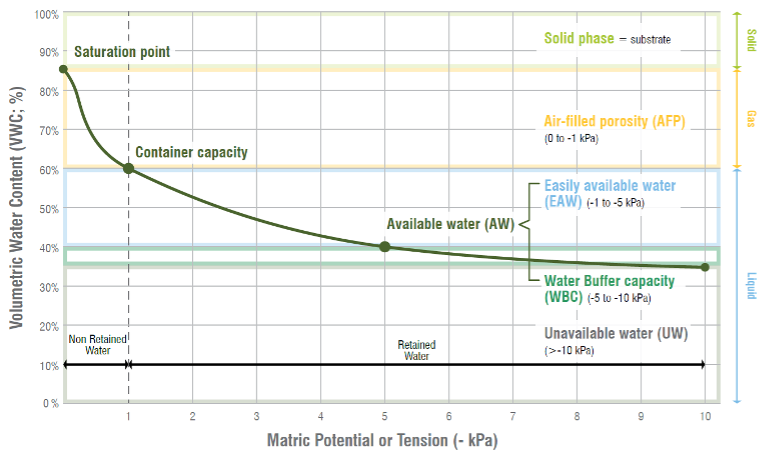
Interpretation and application of the information provided in this graph depend on several factors, such as the dimensions of the container used, the crop and its stage of development, the location of the tensiometer in the container, the percentage of leaching targeted, the composition of the substrate, the irrigation method, etc. Generally speaking, we consider that the available water is present at a tension of between – 1 kPa and – 5 kPa, to be adapted according to the above-mentioned parameters.
To help you apply the concepts discussed in this article, Berger has a team of technical and R&D consultants available to all our customers. Don’t hesitate to contact us for more information!

By Hugo Alix, agr., M. Sc.
GROWER ADVISOR